Industry
Fuel consumption by sub-sector sourced from IEA energy balance. The breakdown of the industrial sectors can be seen below, together with the correspondence with the sectoral breakdown used in the IEA energy balances
Industry sub-sectors represented in KiNESYS KiNESYS
Units
Description
IEA FLOW
IPC
mt
Petrochemicals - multiple products with different technologies with feedstock and fuel input
CHEMICAL,NECHEM
IFP
Petajoules
Food processing
FOODPRO
IIS
mt
Iron and Steel
IRONSTL
ILP
mt
Pulp and Paper
PAPERPRO
IMC
Petajoules
Mining and Construction
CONSTRUC,MINING
INF
mt
Non-ferrous metals
NONFERR
INM
mt
Non-metals
NONMET
IOI
Petajoules
Other
INONSPEC,TEXTILES,WOODPRO
ITM
Petajoules
Transport equip and machinery
MACHINE,TRANSEQ
ONO
Petajoules
Other non-specified
ONONSPEC
End-use fuel consumption splits into energy services sourced from 2018 MECS
Energy services in KiNESYS KiNESYS
Description
MECS service
STM
Steam
Conventional Boiler Use
PRH
Process heat
Process Heating
PRC
Process Cool
Process Cooling and Refrigeration
MDR
Machine drive
Machine Drive
ECP
Electrochemical
Electro-Chemical Processes
OTP
Other process
Other Process Use
SPC
Space conditioning
Facility HVAC
LIG
Lighting
Facility Lighting
OTH
Other facility
Other Facility Support, Onsite Transportation, Conventional Electricity Generation, Other Non-process Use
Physical production of industries sourced from USGS and FAOStats
New technologies (producing energy services) sourced from EPA-US9r model
Petrochemicals
The petrochemical industry is a cornerstone of modern economies, providing essential materials for plastics, fertilizers, and synthetic chemicals. However, it is also a significant source of greenhouse gas emissions. KiNESYS models the petrochemicals sector in detail, capturing the complex processes, energy requirements, and potential pathways for decarbonization.
Scope and Coverage
Key Product Categories
Basic Chemicals:
Ethylene, propylene, and aromatics (benzene, toluene, xylene).
Critical building blocks for a variety of end products.
Intermediates and Derivatives:
Includes methanol, ammonia, and urea, which are widely used in fertilizers and industrial chemicals.
Captures production pathways for polyethylene, PVC, and synthetic rubbers.
End Products:
Plastics, resins, and fibers used in construction, packaging, and textiles.
Processes and Technologies
Steam Cracking: - Models the primary process for producing ethylene and propylene. - Tracks energy use, feedstock variations (naphtha, ethane, propane), and emissions.
Ammonia and Urea Production: - Captures the energy-intensive Haber-Bosch process. - Includes CO₂ utilization in urea production as a decarbonization option.
Polymerization: - Tracks processes for converting monomers into polymers like polyethylene and polypropylene. - Includes energy inputs and associated emissions.
Aromatics and Derivatives: - Models processes like catalytic reforming and cracking for benzene, toluene, and xylene production.
Methanol and Derivatives: - Covers production from both fossil-based and renewable feedstocks (e.g., green methanol from CO₂ and hydrogen).
Feedstock and Energy Inputs
- Fossil Feedstocks:
Tracks naphtha, natural gas, coal, and LPG.
- Renewable Alternatives:
Includes bio-based feedstocks and hydrogen for green chemicals.
- Energy Sources:
Models electricity, steam, and heat demand across processes.
Emissions and By-products
Greenhouse Gas Emissions:
Process emissions, including CO₂ from reforming and cracking.
Combustion emissions from energy use.
By-products:
Tracks co-production of hydrogen, steam, and syngas for use in other sectors.
Key Features for Decarbonization Analysis
Electrification
Electric Steam Cracking:
Models the replacement of conventional furnaces with electric cracking units powered by renewable electricity.
Evaluates technology readiness and scaling challenges.
Feedstock Substitution
Bio-Based Feedstocks:
Includes scenarios for shifting from fossil to biomass-derived naphtha or ethanol.
Green Hydrogen Integration:
Tracks the use of green hydrogen in ammonia, methanol, and other processes.
Carbon Capture and Utilization (CCU)
Ammonia and Methanol:
Models CO₂ capture and integration into products like urea and methanol.
Polymer Production:
Explores pathways for producing plastics with embedded carbon.
Process Optimization
Heat Recovery:
Includes waste heat recovery systems to improve overall energy efficiency.
Catalyst Upgrades:
Simulates the adoption of advanced catalysts for higher yields and lower emissions.
Regional Contextualization
Reflects regional variations in feedstock availability, energy infrastructure, and policy landscapes.
Customizes decarbonization strategies to align with local market conditions.
Model Outputs
Energy and Emissions Profiles:
Comprehensive analysis of energy use and emissions for each production process.
Highlights the impacts of adopting renewable energy and alternative feedstocks.
Technology Scenarios:
Tracks adoption rates for electrification, green hydrogen, and CCU technologies.
Evaluates costs, emissions reductions, and scalability.
Depth of Analysis
Integrated Pathways:
Links petrochemical production to upstream energy systems and downstream manufacturing industries.
Enables holistic assessments of value chain decarbonization.
Policy and Market Impacts:
Simulates the effects of carbon pricing, subsidies for green hydrogen, and CCU mandates.
Evaluates market shifts under global and regional decarbonization scenarios.
Long-Term Strategies:
Provides insights into the evolution of the sector under different technology and policy trajectories.
Supports planning for net-zero transitions.
Driving Change in the Petrochemical Industry
The KiNESYS platform enables detailed analysis of the petrochemical sector, balancing its critical role in modern economies with the urgent need for decarbonization. By modeling advanced technologies and energy optimization strategies, it supports the transition to a sustainable future.
Iron and Steel
The iron and steel sector is fundamental to modern infrastructure and industrial development, yet it remains one of the most energy-intensive and carbon-intensive industries globally. Within its multi-sector global energy system framework, KiNESYS models this sector with detailed representation of production routes, material flows, and decarbonization pathways. This granularity—embedded alongside power, transport, buildings, and other industrial sectors—enables integrated analysis of transition strategies from today’s high-emission processes to tomorrow’s low-carbon alternatives.
Scope and Coverage
Production Routes
KiNESYS models three distinct steelmaking pathways, each with unique characteristics, emission profiles, and decarbonization opportunities:
Blast Furnace - Basic Oxygen Furnace (BF-BOF) Route:
The traditional, carbon-intensive pathway using iron ore and metallurgical coke
Modern BF: Advanced blast furnaces with improved efficiency and reduced emissions
Modern BF with CCS: Blast furnaces equipped with carbon capture and storage
Conventional BOF: Traditional basic oxygen furnaces for refining pig iron
Conventional BOF with CCS: BOF systems integrated with carbon capture technology
Coke ovens: Convert coking coal to metallurgical coke, producing valuable by-products
Direct Reduced Iron (DRI) Route:
Cleaner alternative to blast furnaces, producing sponge iron for electric arc furnaces
Natural Gas-Based Midrex: Uses natural gas as the primary reducing agent
Natural Gas-Based Midrex with CCS: Midrex process with integrated carbon capture
Coal-Based Rotary Kiln: Uses coal for reduction in regions with limited gas access
Coal-Based Rotary Kiln with CCS: Coal-based DRI with emissions capture
Hydrogen-Based Reduction: Revolutionary pathway using green hydrogen for near-zero emissions
Electric Arc Furnace (EAF) Route:
Predominantly scrap-based steelmaking with significantly lower emissions
Electric Arc Furnace: Primary technology for melting scrap and DRI
Induction Furnace: Smaller-scale, high-quality steel production
Ladle Refining Furnace: Secondary refining for precise composition control
Continuous Casting: Efficient conversion of molten steel to semi-finished products
Supporting Infrastructure
The model captures essential upstream and downstream processes:
- Ore Preparation:
Pelletizing plants: Transform concentrated ore into pellets for blast furnaces or DRI
Sintering plants: Agglomerate iron ore fines for blast furnace feed
Crushing and beneficiation: Prepare raw ore for processing
- Material Handling:
Cooling systems: Cool hot DRI for safe handling and transport
Briquetting: Compact DRI to improve density and handling characteristics
Transport logistics: Rail and truck transport of materials
Feedstock and Energy Inputs
- Primary Raw Materials:
Iron ore (various grades and concentrations)
Coking coal for coke production
Limestone and dolomite as fluxing agents
Steel scrap (quality-graded for different applications)
- Alternative Inputs:
Natural gas for DRI production
Green hydrogen for zero-emission reduction
Biomass and alternative fuels for process heat
- Energy Systems:
Electricity: Critical for EAF route and hydrogen production
Process heat: Steam and thermal energy across production stages
By-product gases: Coke oven gas, blast furnace gas for energy recovery
Material Flows and Commodities
The model tracks over 25 distinct material commodities through the steel production chain:
Upstream: Iron ore, concentrated ore, pellets, sinter, coke
Intermediate: Pig iron, sponge iron (DRI), molten steel
Downstream: Refined steel, slabs, finished products
Additives: Fluxes, ferroalloys, refining agents
By-products: Slag, process gases, waste heat
International Trade of Steel-Related Commodities
Steel decarbonization is as much a story about restructuring global trade as it is about changing technology. KiNESYS explicitly models international trade for five key steel-sector commodities, each flowing through a global market mechanism across all regions:
Iron ore — the dominant seaborne commodity today (~1,580 Mt/yr), connecting mines in Australia, Brazil, and Africa to blast furnaces and DRI plants worldwide
Coking coal — essential feedstock for the BF-BOF route (~330 Mt/yr traded), highly concentrated among a few exporters
Steel scrap — increasingly traded as EAF capacity grows; availability constrained by accumulated steel stock in each region
Sponge iron (DRI) — a commodity that barely features in today’s trade (~12 Mt) but emerges as a major flow under decarbonization, as DRI production gravitates to regions with cheap natural gas or renewable hydrogen and ships the intermediate product to steelmakers elsewhere
Crude steel — traded as semi-finished product; subject to configurable trade constraints to reflect real-world frictions such as reheating costs, quality-control requirements, and industrial policy preferences
Trade constraints can be applied at the commodity level to test the sensitivity of results to trade openness. For example, restricting crude steel trade forces the model to use sponge iron as the primary mechanism for international material flows — a choice with profound implications for port infrastructure, shipping patterns, and regional industrial structure.
The model reports regional exports (VAR_FIn on global market processes) and imports (VAR_FOut), enabling analysis of bilateral trade patterns, net trade positions, and the geopolitical implications of different decarbonization pathways.
Emissions and By-products
Greenhouse Gas Emissions:
Process emissions from iron ore reduction (CO₂ from coke combustion)
Calcination emissions from limestone decomposition
Combustion emissions from fossil fuel use in heating and processing
Indirect emissions from electricity generation
Valuable By-products:
Coke oven gas: High-energy gas for process heating or power generation
Blast furnace gas: Lower-energy gas suitable for heating applications
Slag: Reusable in cement production and construction
Waste heat: Recoverable for district heating or power generation
Key Features for Decarbonization Analysis
This granular representation enables exploration of questions along multiple dimensions:
Hydrogen-Based Direct Reduction
Green Hydrogen Integration:
Models the complete replacement of natural gas or coal with hydrogen in DRI production
Produces high-purity sponge iron with near-zero direct CO₂ emissions
Requires integration with renewable electricity for hydrogen production
Tracks infrastructure requirements and scaling challenges
Technology Readiness:
Evaluates pilot-scale demonstrations and commercial deployment timelines
Analyzes cost trajectories as hydrogen production scales
Assesses regional suitability based on renewable energy availability
Carbon Capture and Storage (CCS)
BF-BOF with CCS:
Captures up to 90% of process emissions from blast furnaces and steel plants
Models both post-combustion and pre-combustion capture technologies
Tracks retrofitting costs for existing facilities
Analyzes energy penalties and efficiency impacts
DRI with CCS:
Captures emissions from natural gas or coal-based DRI production
Evaluates technical feasibility and economic viability
Models integration with CO₂ transport and storage infrastructure
CCS as an infrastructure-preservation choice:
A distinguishing feature of KiNESYS’s integrated approach: CCS availability does not merely reduce emissions — it determines whether the entire incumbent raw-material complex (iron ore mining, coking coal supply chains, blast furnace infrastructure, associated port and shipping capacity) survives the transition. Two pathways with identical carbon prices and similar emissions outcomes can produce completely different industrial structures depending on CCS availability, with far-reaching consequences for trade flows, regional employment, and infrastructure investment
Scrap-Based Steelmaking
EAF Route Expansion:
Tracks the evolution of scrap availability across 30 global regions
Models scrap quality grades and their suitability for different steel products
Analyzes the ~70% emissions reduction compared to primary steelmaking
Projects scrap supply growth based on historical steel production and stock accumulation
Scrap Availability Dynamics:
Time horizon: 2019-2050 with annual resolution
Regional differentiation: China, India, USA, EU, Brazil, and 25 other regions
Quality considerations: Obsolete scrap, prompt scrap, and home scrap
Circularity constraints: Physical limits on scrap-based production — model results consistently show scrap-EAF capping at around 40–45% of global crude steel demand even under maximum decarbonization, confirming that there is no purely circular future for steel. The remaining demand must be met by primary iron (via DRI or BF-BOF), which in turn drives continued iron ore trade
Process Efficiency Improvements
Modern Technologies:
Advanced blast furnaces with pulverized coal injection
Top-pressure recovery turbines for energy efficiency
Optimized coke oven designs with improved thermal efficiency
High-efficiency electric arc furnaces with scrap preheating
Energy Recovery:
Waste heat recovery from coke ovens, blast furnaces, and steel furnaces
By-product gas utilization for power generation
Integration with industrial symbiosis networks
Material Efficiency
Yield Optimization:
Improved casting technologies to reduce material losses
Near-net-shape manufacturing to minimize downstream processing
Precision steel grades to reduce over-specification
Circular Economy:
Slag valorization for cement and construction applications
Dust and sludge recycling within steel plants
Extended product lifespans through high-performance steel grades
Regional Contextualization
Technology Costs:
Regional variations in capital costs (CAPEX) and operating costs (OPEX)
Reflects differences in labor costs, equipment prices, and financing conditions
Captures economies of scale and learning rates
Resource Endowments:
Iron ore quality and accessibility (Australia, Brazil, India)
Coking coal availability and quality
Natural gas infrastructure for DRI production
Renewable energy potential for green hydrogen
Infrastructure Readiness:
Electricity grid capacity for EAF expansion
CO₂ transport and storage infrastructure for CCS
Hydrogen production and distribution networks
Scrap collection and processing systems
Model Outputs
Different types of outputs can be readily configured on dashboards that hold output from rich scenario experiments—ready for what-if analysis with presolved cases by diverse stakeholders and domain experts:
Energy and Emissions Profiles:
Detailed energy consumption by source (electricity, coal, natural gas, hydrogen)
Comprehensive emissions accounting: direct process emissions, combustion emissions, indirect emissions
Technology-specific emission intensities (kg CO₂/ton steel)
Regional emission profiles reflecting local energy mixes
Technology Adoption Scenarios:
Penetration rates for hydrogen-based DRI under different policy scenarios
CCS deployment timelines and capacity additions
EAF capacity expansion constrained by scrap availability
Investment requirements and financing needs
Cost and Competitiveness Analysis:
Production cost breakdowns by technology route
Impact of carbon pricing on technology competitiveness
Green premium for low-carbon steel
Trade implications under carbon border adjustment mechanisms
Material Flow Analysis:
Iron ore demand projections by region and quality grade
Coking coal requirements and potential for substitution
Scrap flows and circularity rates
Hydrogen demand for steel sector decarbonization
Visualisation and Communication:
Sankey diagrams of material flows (raw materials → steelmaking routes → crude steel, with CO₂ exit flows) for any scenario and region, enabling direct visual comparison of structurally distinct futures
Time-series trajectory charts showing how key metrics (production, CO₂ intensity, route shares, hydrogen consumption, steel cost, trade volumes) evolve from present to 2050 across large scenario ensembles
Trade composition charts decomposing global steel-related seaborne trade by commodity, revealing how the cargo on ships changes under different policy settings
Regional trade butterfly charts showing net exporter/importer positions for each commodity under multiple scenarios, exposing the geopolitical dimension of decarbonization
Illustrative Findings
The following results illustrate the type of insight the model produces when scenario dimensions (carbon price, CCS availability, technology cost assumptions) are varied systematically. These are representative, not prescriptive — actual results depend on the specific scenario configuration and regional calibration.
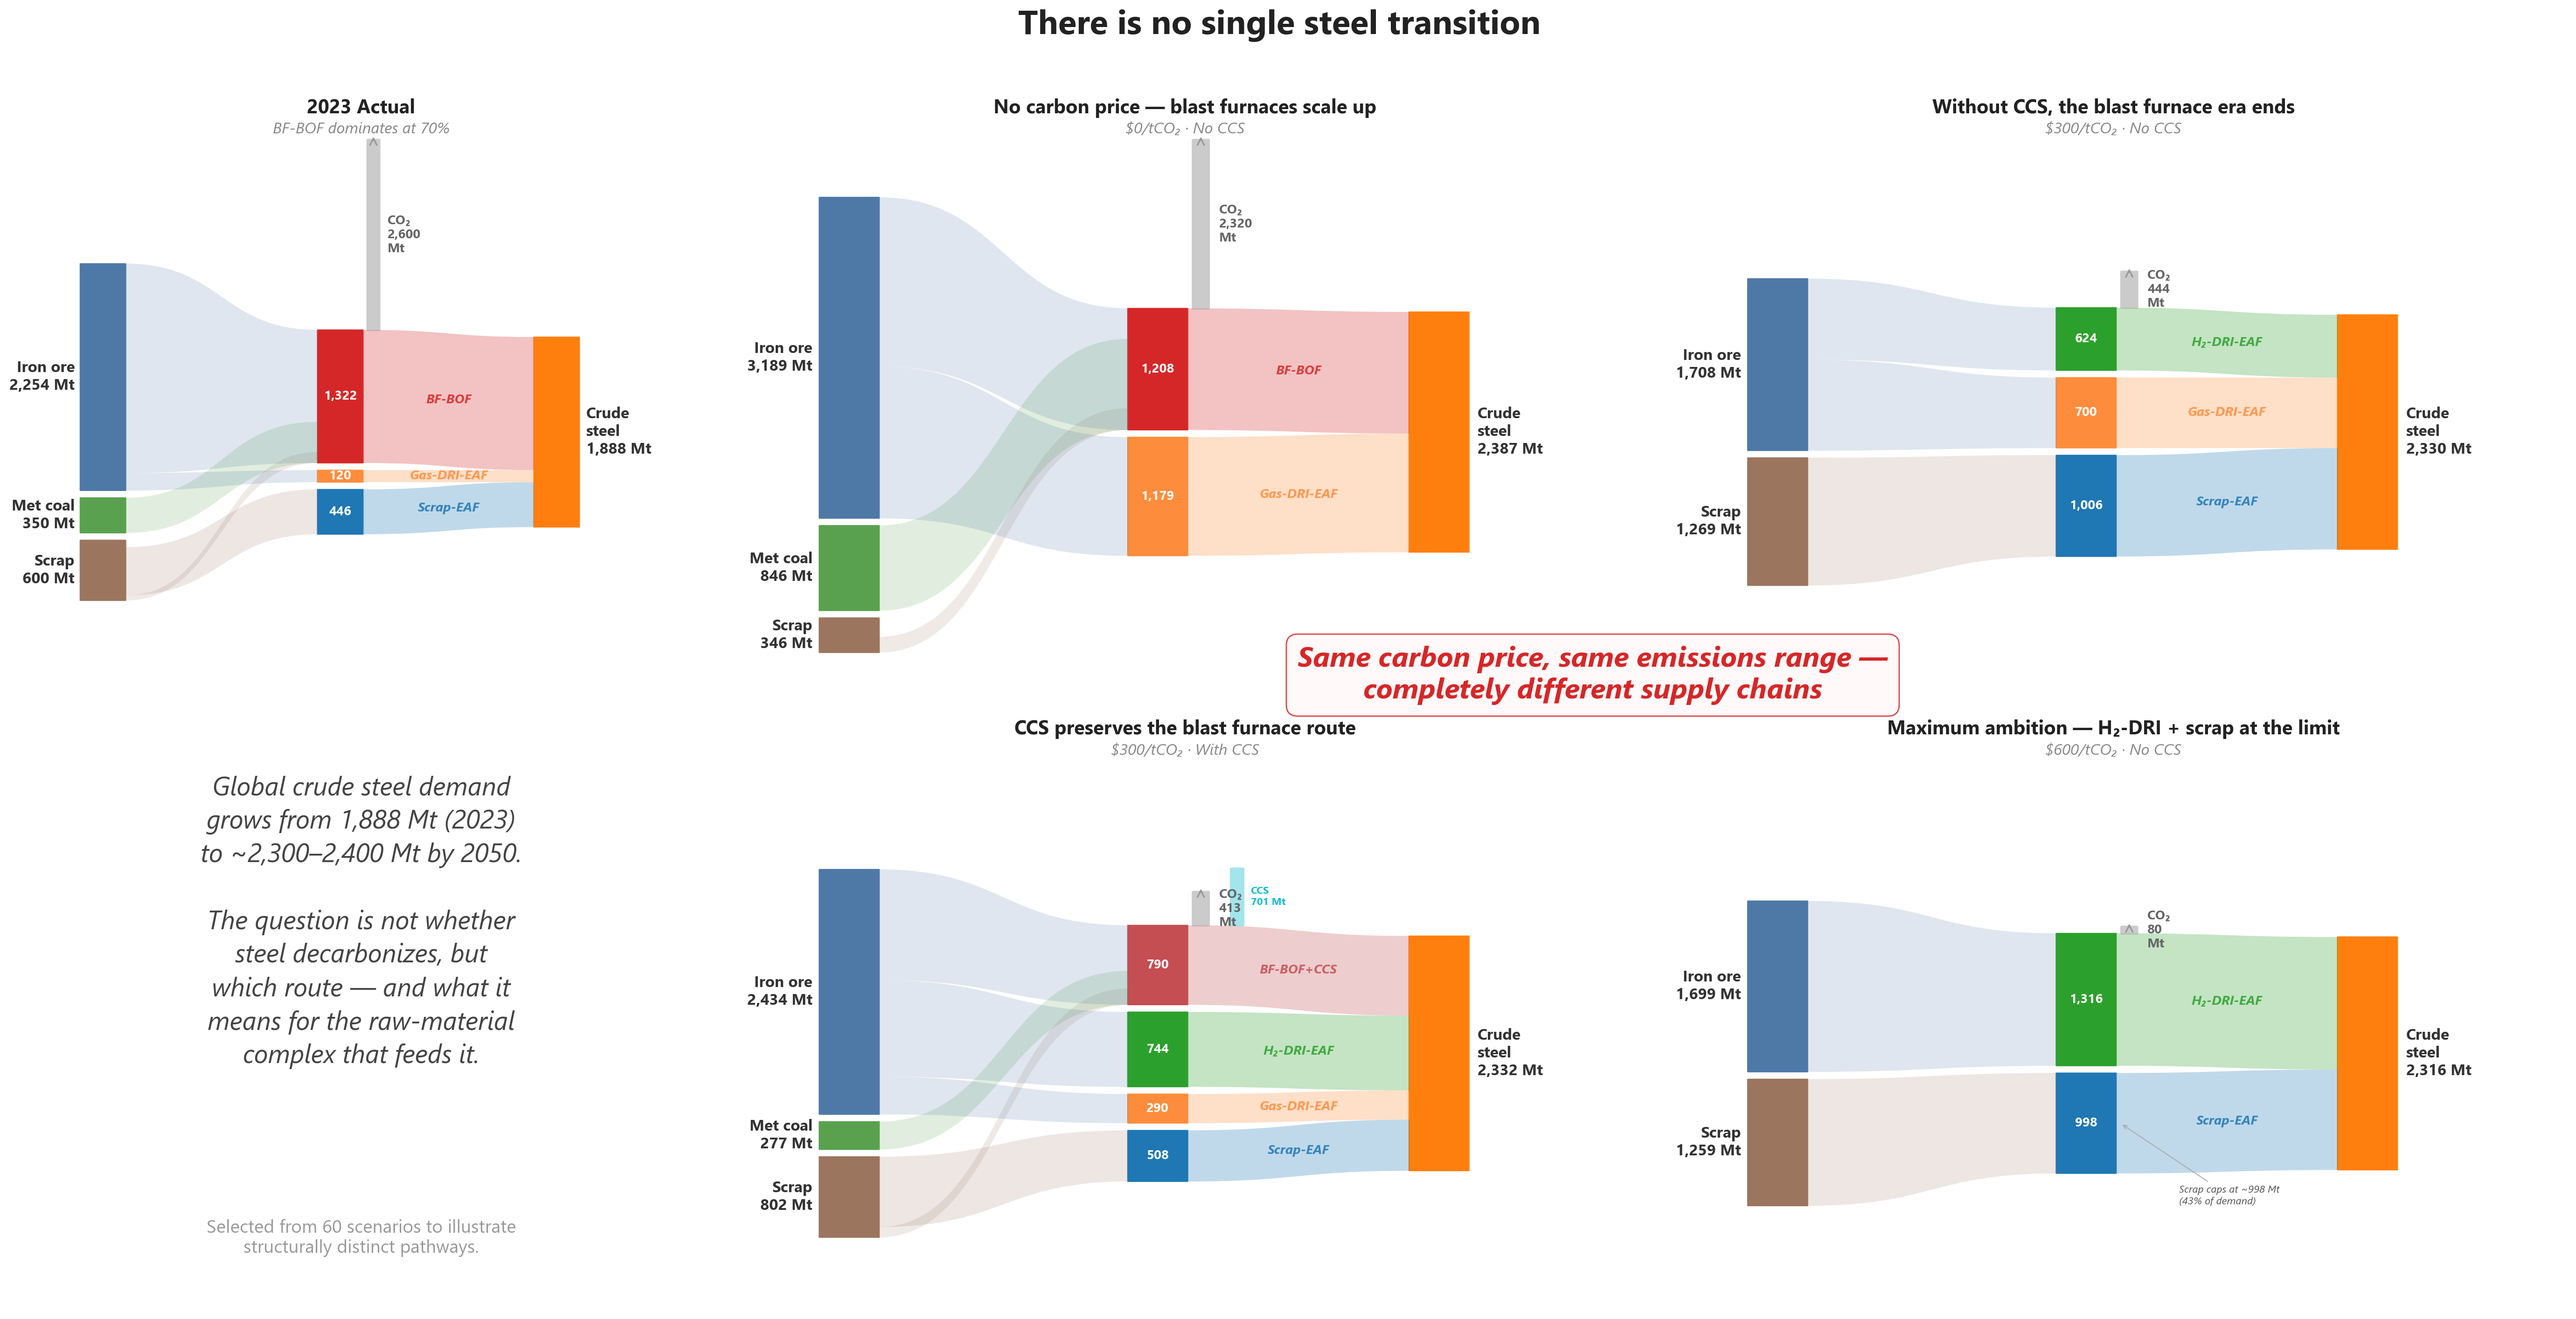
Sankey quartet — four structurally distinct steel futures at 2050. Each panel traces material flows from raw inputs (left) through steelmaking routes (centre) to crude steel output (right), with CO₂ exit flows shown upward. The 2023 baseline (top-left) is dominated by blast furnaces; the four 2050 scenarios show how the system transforms under different carbon price and CCS availability assumptions. Panels sharing the same carbon price (bottom pair) achieve similar emissions reductions but with completely different supply chains.
Structurally distinct futures at the same carbon price. Under a moderate carbon price with CCS available, the BF-BOF route can survive — preserving the iron ore and coking coal supply chain, with CCS capturing several hundred Mt CO₂. Under the same carbon price without CCS, blast furnaces are eliminated entirely: DRI-EAF and Scrap-EAF dominate, coal disappears, and the energy mix shifts to gas, hydrogen, and electricity. Both pathways achieve comparable emissions reductions (75–85% below baseline), but the industrial structures — and therefore the infrastructure, trade, and employment implications — are completely different.
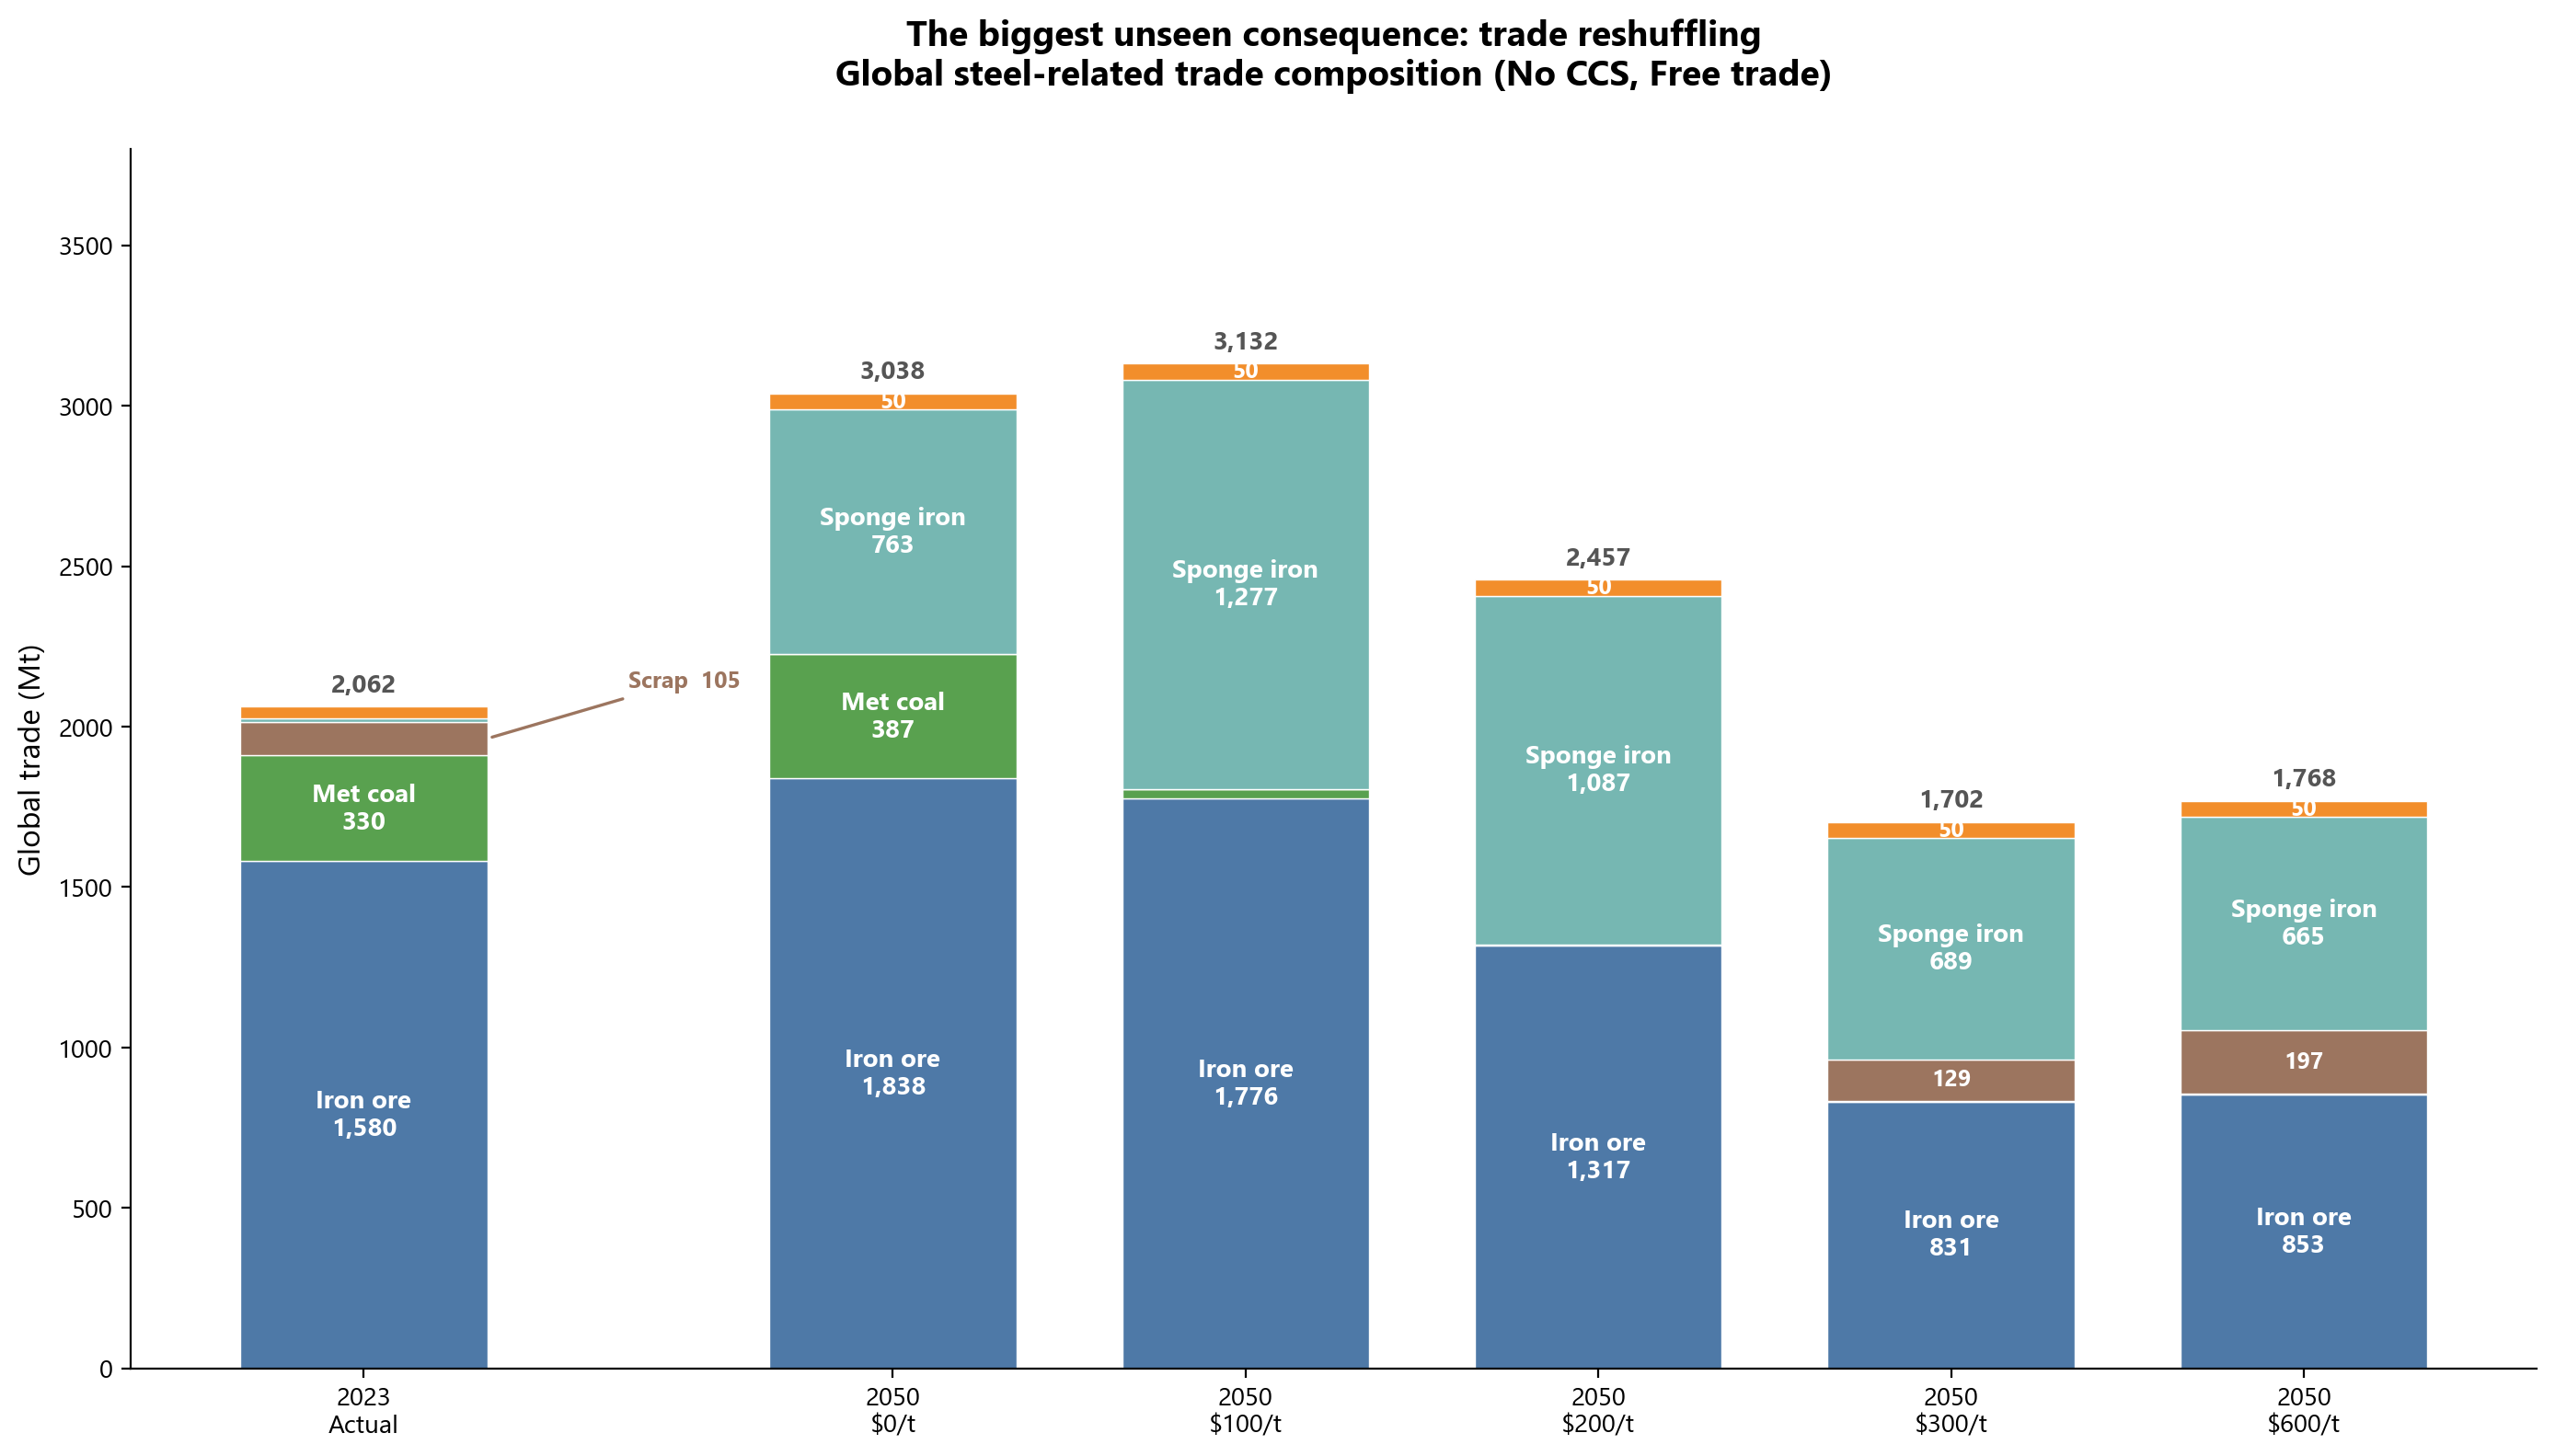
Global steel-related trade composition — from today to five carbon-price futures. Each bar decomposes total seaborne trade by commodity. Iron ore (blue) dominates today; under decarbonization, coking coal disappears, sponge iron (teal) surges, and the total initially rises before falling. Crude steel trade is constrained to reflect reheating and quality frictions.
Trade reshuffling, not just trade reduction. Steel-related global trade (iron ore + coking coal + sponge iron + scrap + crude steel) can initially increase under low-to-moderate carbon prices as DRI production concentrates in gas- and renewables-rich regions and ships sponge iron globally. At higher carbon prices, total trade volumes decline — but the composition is unrecognisable: coking coal disappears, iron ore demand halves, and sponge iron becomes the dominant traded intermediate. The model shows that the decarbonization pathway chosen determines whether the world preserves the incumbent raw-material shipping complex or rewires it.
Bounded green premium. Across a wide range of scenarios, the model-implied cost of crude steel (shadow price from the optimisation) increases by roughly 20–35% under ambitious decarbonization relative to a no-policy baseline. This is significant for a commodity-grade product but far below the 2–3× premiums sometimes cited in public discourse.
No purely circular future. Even under maximum scrap utilisation, EAF-based production from scrap caps at around 40–45% of global crude steel demand — constrained by the physics of steel stock accumulation and scrap availability. The remaining 55–60% must come from primary iron, which means iron ore continues to be mined and traded in all futures. The question is whether that ore feeds blast furnaces or DRI plants.
Hydrogen consumption at scale. Deep decarbonization scenarios imply hydrogen consumption by the steel sector alone on the order of 25–60 Mt H₂ per year by 2050 — a substantial fraction of projected global clean hydrogen supply and a critical input for hydrogen infrastructure planning.
Depth of Analysis
Comprehensive Technology Portfolio:
Models the full spectrum from conventional high-emission routes to breakthrough technologies
Captures technology-specific parameters: energy inputs, material coefficients, costs, emissions
Reflects regional variations in technology performance and economics
Tracks technology evolution through learning curves and efficiency improvements
Integrated Decarbonization Pathways:
Analyzes synergies and trade-offs between different decarbonization strategies
Models competition for limited resources (scrap, hydrogen, CO₂ storage capacity)
Evaluates timing and sequencing of technology transitions
Assesses system-wide implications for energy demand and infrastructure
Policy and Market Dynamics:
Simulates impacts of carbon pricing, emissions trading, and regulatory mandates
Models subsidies and incentives for low-carbon technologies
Analyzes trade flows under differentiated carbon policies
Evaluates competitiveness impacts and carbon leakage risks
Systemic Integration:
Links steel production with upstream mining and downstream manufacturing
Connects with electricity systems for EAF demand and hydrogen production
Integrates with hydrogen economy for green steel pathways
Couples with CO₂ transport and storage infrastructure for CCS
Scenario Exploration:
Multi-dimensional scenario design: Carbon price levels, CCS availability toggles, technology cost assumptions, and trade regime constraints can be combined to generate large scenario ensembles, enabling systematic exploration of the solution space
Net-zero pathways: Technology mixes and timelines to achieve zero emissions
Resource constraints: Scrap availability, hydrogen production capacity, CCS potential
Regional transitions: Different pathways for each of the 30+ regions based on local resource endowments, existing infrastructure, and accumulated steel stock
Disruptive innovation: Breakthrough technologies and accelerated deployment scenarios
Country-level deep dives: The model supports extraction and visualisation of results for individual regions, revealing how global decarbonization pathways translate into country-specific industrial transformations — including stranding risk for existing capacity, shifts in import dependency, and changes in trade partnerships
Building a Low-Carbon Future for Iron and Steel
Within KiNESYS’s multi-sector global energy system optimization framework, the steel sector representation captures the complete production chain — from iron ore to finished steel — across multiple technology routes and 30+ regions, with explicit international trade of five key commodities. The model includes emerging technologies like hydrogen-based DRI and CCS-equipped facilities, alongside realistic constraints on scrap availability, trade frictions, and infrastructure development.
This level of sectoral detail, integrated within a comprehensive energy system model that simultaneously optimizes power generation, transport, buildings, and other industries, enables analysis of cross-sectoral interactions and competition for limited resources. The steel sector doesn’t operate in isolation — it competes for electricity, hydrogen, biomass, and CO₂ storage capacity with other sectors, and these interactions shape realistic decarbonization pathways.
A key insight from this integrated approach: steel decarbonization is as much a story about relocating industrial production and restructuring global trade as it is about deploying new technology. The chosen pathway determines whether the world preserves the incumbent iron ore and coking coal shipping complex or rewires it around sponge iron and clean hydrogen. KiNESYS is uniquely positioned to explore these trade-offs because it models both the technology transitions and the trade flows simultaneously, within a single optimisation framework.
Cement
Cement is a critical material for infrastructure development but is also one of the most carbon-intensive industrial products. The KiNESYS platform captures the nuances of this sector, enabling an in-depth analysis of its production processes and pathways for decarbonization.
Scope and Coverage
Processes and Technologies
Cement Production:
Clinker Production: Models the calcination process where limestone is converted to clinker, the most carbon-intensive step.
Blending and Grinding: Represents processes for mixing clinker with additives like gypsum to produce cement.
Alternative Binders: Includes supplementary cementitious materials (SCMs) like fly ash, slag, and pozzolans.
Kiln Technologies:
Tracks various kiln types, including wet kilns, dry kilns, and pre-calciner kilns.
Models differences in efficiency and emissions across kiln types.
Regional and Plant-Specific Variations:
Reflects regional differences in kiln technologies and feedstock characteristics (e.g., limestone quality).
Captures variations in operational efficiencies among plants.
Feedstock and Energy Inputs
- Primary Materials:
Tracks limestone, clay, and other raw materials.
- Fuel Inputs:
Includes traditional fuels like coal, petcoke, and natural gas.
Models the adoption of alternative fuels like biomass, waste-derived fuels, and hydrogen.
- Electricity Use:
Accounts for energy needs in grinding and other auxiliary processes.
Emissions and By-products
- CO₂ Emissions:
Process emissions from limestone calcination.
Combustion emissions from kiln operations.
- Co-products:
Tracks opportunities for reusing waste heat and recovering CO₂.
Key Features for Decarbonization Analysis
Process Optimization
- Improved Efficiency:
Models upgrades to kilns, preheaters, and pre-calciner systems to reduce energy use.
Tracks adoption of high-efficiency grinding technologies.
- Operational Excellence:
Simulates scenarios for reducing energy waste during production.
Fuel Switching
- Alternative Fuels:
Models the transition to low-carbon and renewable fuels, such as biomass, hydrogen, and waste-derived fuels.
Evaluates the technical and economic feasibility of various fuel options.
Carbon Capture and Storage (CCS)
Tracks the deployment of CCS technologies to capture emissions from the calcination process.
Models retrofitting existing plants with CCS and its impact on costs and energy use.
Material Substitution
- Reducing Clinker Content:
Simulates blending strategies with Supplementary Cementitious Materials (SCMs) like fly ash, slag, and natural pozzolans.
Evaluates the potential for reducing the clinker-to-cement ratio while maintaining product quality.
Electrification
Explores electrification opportunities in auxiliary processes like grinding and material transport.
Evaluates the role of renewable electricity in lowering indirect emissions.
Regional Contextualization
Adapts decarbonization pathways to regional infrastructure, policy, and resource availability.
Considers proximity to SCM sources and renewable energy availability.
Model Outputs
- Energy and Emissions Profiles:
Detailed breakdown of energy use by source (fossil fuels, alternative fuels, electricity).
Quantification of emissions by process step (calcination, fuel combustion).
- Cost and Feasibility Analyses:
Evaluates the costs of adopting low-carbon technologies and alternative fuels.
Assesses financial and operational impacts of reducing clinker content.
- Scenario Comparisons:
Tracks the impact of policies like carbon pricing, subsidies for CCS, and renewable energy incentives.
Simulates timelines for achieving emissions reductions under different scenarios.
Depth of Analysis
Technology Pathways:
Tracks technological upgrades and new installations for energy efficiency and emissions reductions.
Enables long-term planning for the integration of cutting-edge technologies like CCS.
Policy Implications:
Models the effects of regulatory frameworks, including emissions trading schemes and mandatory fuel-switching requirements.
Simulates responses to global and regional carbon border adjustment mechanisms.
Systemic Insights:
Links cement production to other industrial and energy sectors, highlighting co-benefits of integrated strategies.
Enables comprehensive analysis of supply chain sustainability.
Making Cement Cleaner
The KiNESYS platform provides an essential toolkit for exploring decarbonization in the cement sector. By capturing every aspect of production, emissions, and potential innovation, it empowers stakeholders to craft actionable strategies for reducing the sector’s environmental impact.
Ceramics
The ceramics sector is diverse, spanning applications from construction to advanced technologies. KiNESYS models this complexity, capturing the energy-intensive processes, material flows, and potential for decarbonization across various sub-sectors.
Scope and Coverage
Sub-Sectors of Ceramics
Technical Ceramics:
Used in high-performance applications like electronics, aerospace, and medical devices.
Involves precision manufacturing with specialized materials.
Sanitaryware Ceramics:
Includes sinks, toilets, and other household sanitary products.
Focuses on high-volume production with uniform material and energy requirements.
Construction Ceramics:
Bricks, tiles, and other building materials.
Represents the bulk of ceramic production by volume.
Processes and Technologies
Material Preparation:
Models the procurement and processing of raw materials like clay, feldspar, and kaolin.
Includes the addition of additives and preparation for shaping.
Shaping and Forming:
Captures techniques like extrusion, pressing, and casting used across sub-sectors.
Models differences in energy and material intensity for each method.
Drying and Firing:
Tracks energy-intensive kiln operations, which account for the majority of emissions.
Includes temperature profiles and duration for firing based on product type.
Finishing and Coating:
Represents glazing, polishing, and other surface treatments.
Models the additional energy requirements for advanced finishing processes.
Feedstock and Energy Inputs
Raw Materials:
Tracks clay, feldspar, and kaolin inputs, along with additives for specific properties.
Energy Sources:
Dominated by fossil fuels (natural gas, coal) for firing processes.
Incorporates electrification and alternative fuels in advanced scenarios.
Emissions and By-products
Greenhouse Gas Emissions:
Process emissions from material reactions during firing.
Combustion emissions from kilns.
By-products:
Waste heat recovery potential from kiln operations.
Recycled scrap materials from production rejects.
Key Features for Decarbonization Analysis
Electrification
Models the shift from fossil-fueled kilns to electric kilns powered by renewable energy.
Evaluates the readiness of electric kilns for high-temperature firing.
Alternative Fuels
Tracks the integration of hydrogen, biogas, and waste-derived fuels in kiln operations.
Evaluates the technical and economic feasibility of these fuels in different sub-sectors.
Process Optimization
Includes upgrades to kiln efficiency, such as advanced insulation and regenerative burners.
Simulates improved shaping and drying processes to minimize energy demand.
Material Substitution
Evaluates the use of low-carbon raw materials, such as synthetic or recycled clays.
Models the impact of reducing raw material requirements through lightweight design.
Regional Contextualization
Customizes pathways based on regional raw material availability, energy infrastructure, and policy support.
Reflects variations in kiln technology and product demand across regions.
Model Outputs
Energy and Emissions Profiles:
Detailed energy use breakdown for each process stage and energy source.
Comprehensive emission metrics for kilns and other energy-intensive steps.
Technology Transition Scenarios:
Tracks adoption rates for electric kilns, alternative fuels, and advanced materials.
Simulates long-term impacts of decarbonization on production costs and competitiveness.
Depth of Analysis
Sub-Sector Specificity:
Captures the unique characteristics of technical, sanitaryware, and construction ceramics.
Enables detailed decarbonization roadmaps for each sub-sector.
Integrated Systems Approach:
Links ceramic production with energy systems and waste management.
Highlights co-benefits of strategies like waste heat recovery and material efficiency.
Policy and Market Dynamics:
Simulates the impact of carbon pricing, subsidies for advanced technologies, and energy efficiency mandates.
Evaluates market responses to decarbonization strategies, including shifts in demand.
Shaping a Sustainable Future for Ceramics
KiNESYS provides a powerful platform for analyzing the ceramics sector, offering granular insights into its processes, energy use, and emissions. By modeling innovative technologies and advanced materials, it supports the development of robust decarbonization pathways.
Glass
The glass industry is pivotal for sectors such as construction, packaging, and automotive. KiNESYS models the nuances of glass production with a focus on energy use, material flows, and emissions. This enables stakeholders to explore decarbonization pathways tailored to the unique needs of the sector.
Scope and Coverage
Processes and Technologies
Types of Glass Production:
Container Glass: Bottles and jars used in packaging.
Flat Glass: Sheets used in windows, automotive, and solar panels.
Fiber Glass: Insulation and reinforced composites for construction and manufacturing.
Manufacturing Steps:
Melting: High-temperature furnaces melt raw materials into molten glass.
Forming: Techniques like molding (container glass), float processes (flat glass), and spinning (fiber glass).
Annealing and Finishing: Controlled cooling and surface treatments for strength and quality.
Energy Sources:
Fossil fuels (natural gas, fuel oil) dominate, but electricity is gaining traction in modern systems.
Includes renewable energy integration for electric furnaces.
Feedstock and Energy Inputs
Primary Raw Materials:
Silica sand, soda ash, limestone, and dolomite.
Models variations in purity and composition for different types of glass.
Emissions and By-products
Greenhouse Gas Emissions:
Process emissions from raw material reactions.
Combustion emissions from melting furnaces.
By-products:
Waste heat from furnaces and opportunities for its recovery.
Key Features for Decarbonization Analysis
Electrification
Electric Melting:
Models the transition from gas-fired furnaces to electric ones powered by renewable energy.
Analyzes efficiency gains and emission reductions.
Alternative Fuels
Hydrogen and Biomass:
Models the feasibility of using hydrogen or biomass as fuel for glass furnaces.
Waste-Derived Fuels:
Evaluates the use of by-products from other industries, such as RDF (Refuse-Derived Fuel).
Energy Efficiency
Furnace Upgrades:
Tracks technologies like oxy-fuel burners and regenerative furnaces.
Process Optimization:
Models improvements in forming and annealing processes to reduce energy consumption.
Decarbonization of Raw Materials
Low-Carbon Soda Ash:
Evaluates the use of carbon-neutral soda ash alternatives.
Alternative Material Inputs:
Models innovations in reducing emissions from raw material processing.
Regional Contextualization
Reflects regional differences in energy costs, raw material availability, and infrastructure.
Customizes decarbonization pathways to local policy and market conditions.
Model Outputs
- Energy and Emissions Profiles:
Detailed breakdown of energy use by source (fossil fuels, electricity, alternative fuels).
Comprehensive emission metrics, highlighting areas for improvement.
- Cost and Competitiveness Analysis:
Tracks the financial implications of transitioning to low-carbon technologies.
Simulates the impact of carbon pricing and subsidies for electrification.
- Scenario Analysis:
Explores the potential for scaling renewable energy and alternative fuel adoption.
Evaluates the long-term impact of decarbonization on market competitiveness.
Depth of Analysis
Technology Pathways:
Simulates adoption rates for emerging technologies like electric furnaces and hydrogen integration.
Evaluates readiness and feasibility for retrofitting existing plants.
Policy Support:
Models the impact of regulations and incentives for alternative fuels and renewable energy integration.
Systemic Insights:
Links glass production with upstream raw material supply chains and downstream sectors like construction and packaging.
Highlights synergies with energy and waste management systems.
Advancing Sustainability in Glass Production
KiNESYS provides a robust framework for analyzing the glass sector, capturing its intricate processes, energy demands, and emissions. By modeling innovative technologies and energy optimization strategies, it supports the development of actionable roadmaps for a sustainable glass industry.
Aluminium
Aluminium production is a critical industrial activity due to its versatility and widespread applications in sectors such as transportation, construction, and packaging. However, it is also highly energy-intensive, particularly in the smelting process. KiNESYS provides a detailed framework to model the aluminium sector, addressing its unique energy needs and emissions challenges.
Scope and Coverage
Processes and Technologies
Bauxite Mining and Alumina Refining:
Models the extraction of bauxite and its conversion into alumina (aluminium oxide) through the Bayer process.
Tracks energy use and emissions associated with high-temperature digestion and calcination.
Primary Aluminium Production:
Focuses on the Hall-Héroult process for electrolysis of alumina to produce aluminium.
Includes the carbon anode consumption, a significant source of direct CO₂ emissions.
Casting and Finishing:
Models energy requirements and emissions in shaping and surface treatments.
Feedstock and Energy Inputs
- Raw Materials:
Bauxite as the primary ore.
Includes alumina as a key input for smelting.
- Energy Sources:
Tracks electricity demand for electrolysis, highlighting the critical role of energy decarbonization.
Includes fuel use in refining and calcination processes.
Models regional differences in electricity mix and its impact on emissions.
Emissions and By-products
Greenhouse Gas Emissions:
Process emissions from carbon anode consumption in smelting.
CO₂ emissions during electrolysis.
Combustion emissions from refining and calcination.
By-products:
Tracks red mud waste from refining and evaluates options for reuse or mitigation.
Key Features for Decarbonization Analysis
Electrification
Models the impact of decarbonizing electricity grids on aluminium production.
Simulates the adoption of renewable energy in regions reliant on coal or gas-fired electricity.
Advanced Smelting Technologies
Inert Anodes:
Tracks the transition to inert anodes in electrolysis, eliminating carbon-based anode emissions.
Evaluates technology readiness and cost implications.
Direct Hydrogen Reduction:
Explores emerging technologies that use hydrogen instead of carbon-based anodes.
Energy Efficiency
- Models upgrades to existing technologies, including:
Heat recovery systems in refining.
Improved cell designs for energy-efficient electrolysis.
Waste Management and Circular Economy
Models strategies for managing red mud and converting it into value-added products.
Tracks improvements in waste heat recovery and slag reutilization.
Regional Contextualization
Customizes pathways based on regional energy mixes, resource availability, and policy frameworks.
Highlights differences in emissions profiles between regions reliant on hydroelectricity vs. fossil fuels.
Model Outputs
Energy and Emissions Profiles:
Tracks electricity use and emissions for each production stage.
Provides granular data on the impact of energy decarbonization.
Technology Scenarios:
Evaluates the adoption of inert anodes, energy-efficient technologies, and other innovations.
Quantifies cost and emissions impacts for various decarbonization pathways.
Depth of Analysis
Process-Specific Insights:
Captures the unique energy and emissions characteristics of each production step.
Supports targeted interventions for reducing emissions in refining and smelting.
Policy Impact Simulation:
Models the effect of carbon pricing, renewable energy incentives, and emission reduction targets.
Evaluates regional trade-offs between emissions reduction and economic competitiveness.
Technology Evolution:
Tracks the progress of emerging technologies like inert anodes and direct hydrogen reduction.
Simulates timelines for achieving large-scale adoption.
Building a Low-Carbon Aluminium Industry
The KiNESYS platform models the aluminium sector with precision, offering robust tools for analyzing energy use, emissions, and decarbonization strategies. By addressing both technological and systemic challenges, it supports the transition to a low-carbon aluminium industry.